I knew that I wanted to base my data around networking in some sort of way. I am currently on the waiting list to get fibre. This inspired me to look into how the network speed across Ireland has been affected by the roll out of fibre. I Googled for data on how many properties are connected to the fibre network or average speeds in the home. I looked at nbi.ie, comreg.ie and a few European data sites. No luck. I decided to email the NBI as they have helped me out before. Unfortunately they weren’t able to help me out. So I emailed ComReg and I was in luck! At first they said that what I was looking for wasn’t their department but they forward my email on and I got this back.
"
Hi [name],
Thanks for your query.
The following dataset which we publish on our website should assist you with your project - All-Data-Q3-2024_v2.xlsx
On the Broadband tab
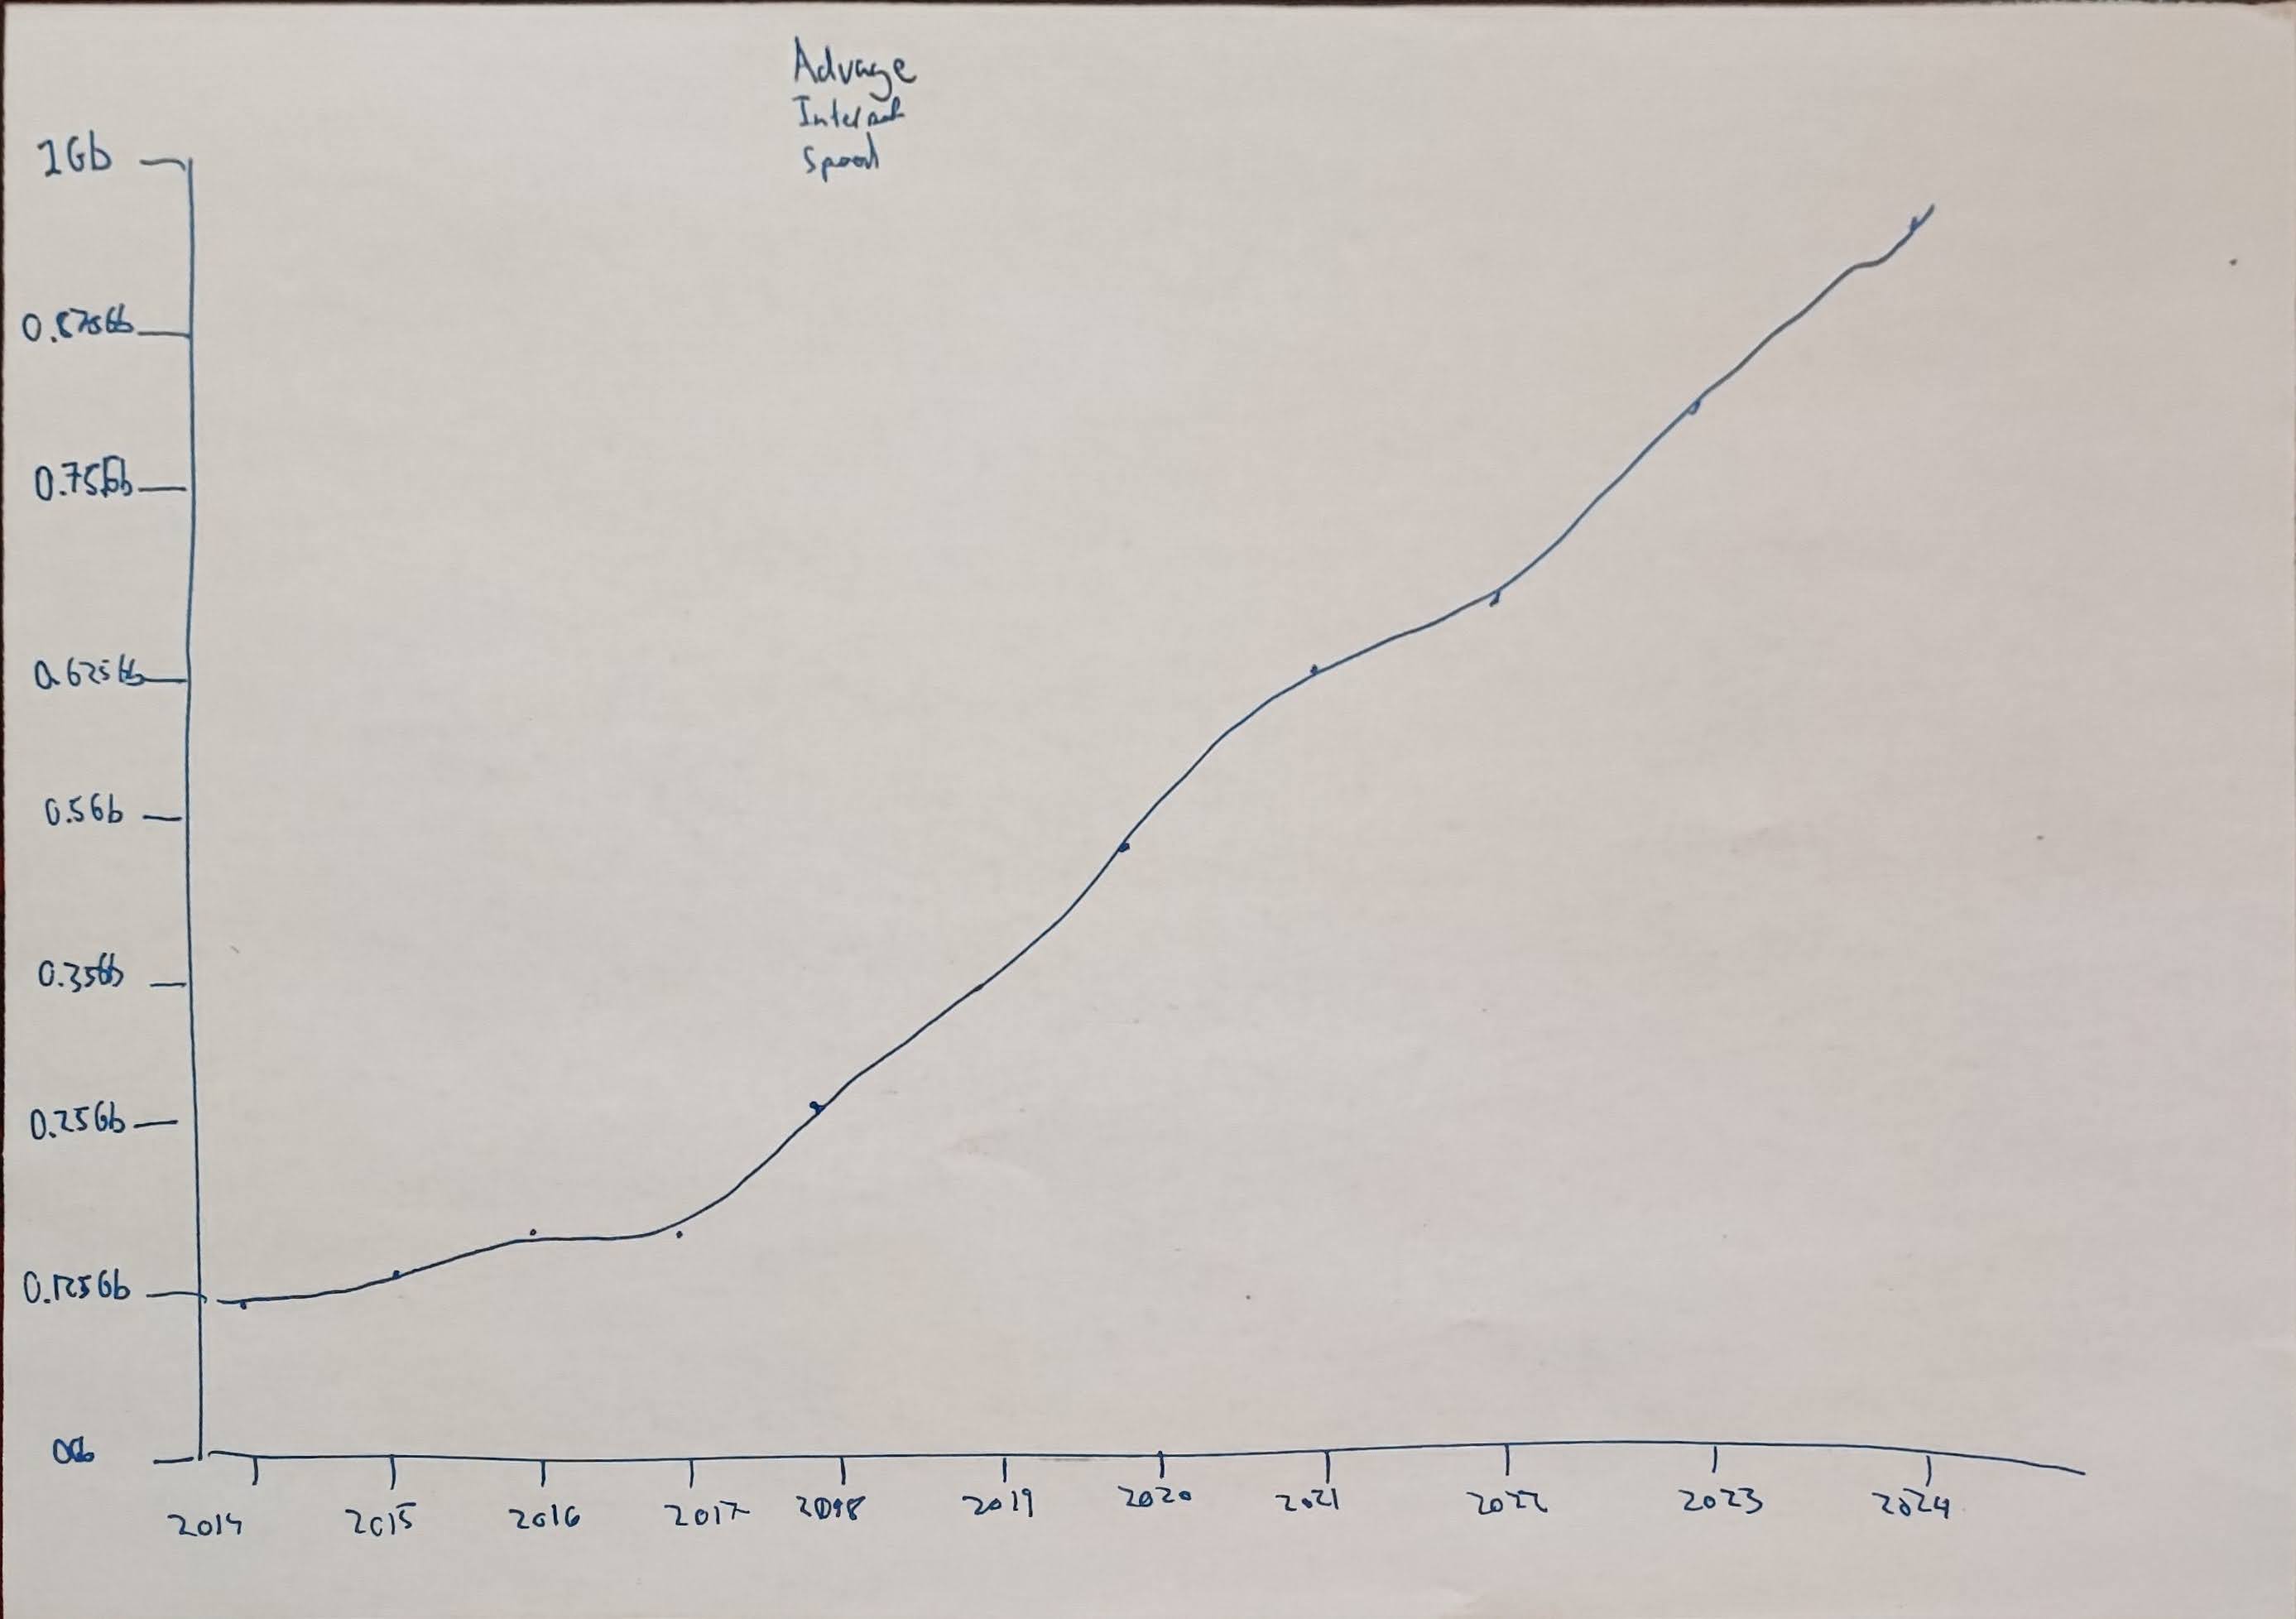
1 Row 12 “Total Fixed Broadband Subscriber Lines” is the number of active broadband lines (i.e. those who are paying for a subscription), lines 6 to 11 break this figure down by the different broadband platforms (e.g. FTTP = Fibre to the Premises i.e. Full Fibre, ADSL = Copper, VDSL = Part Copper/Part Fibre).
2. Row 36 “ Fixed Residential & Business Subscriber Lines by Sold Download Speed’ provides information on what speeds the lines are sold at.
3. Row 66 “Fixed Broadband Subscriber Lines by Sold Download Speeds” gives a percentage breakdown on fixed broadband subscriber lines by speed which shows how speeds have changed over time.
The tab 5.1 Broadband Coverage also may be of interest as this shows the % of Eircodes which have fibre available, there are also some charts in the final tab which you may be able to reuse.
Hope this helps, let me know if you have any further questions.
[name]”
"
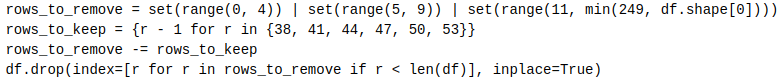
After a quick peep, I knew I had enough data for my project and to conduct my data analysis on. I decided that I would base my data of the FTTP, Total and Total Subsciption Connection Speeds.
3. Plan & Design
Goals:
I will have charts that show how the rollout of fibre broadband has affected the average speed for the consumer.
I will have charts that can be interacted with to help analyse the data further.
I will get my data from a source like NBI so that I can not only trust it but so it would be publicly available.
I will use GitHub to host my website so that not only can I easily view the final result but I can then easily download the files to be placed into my artefacts folder.
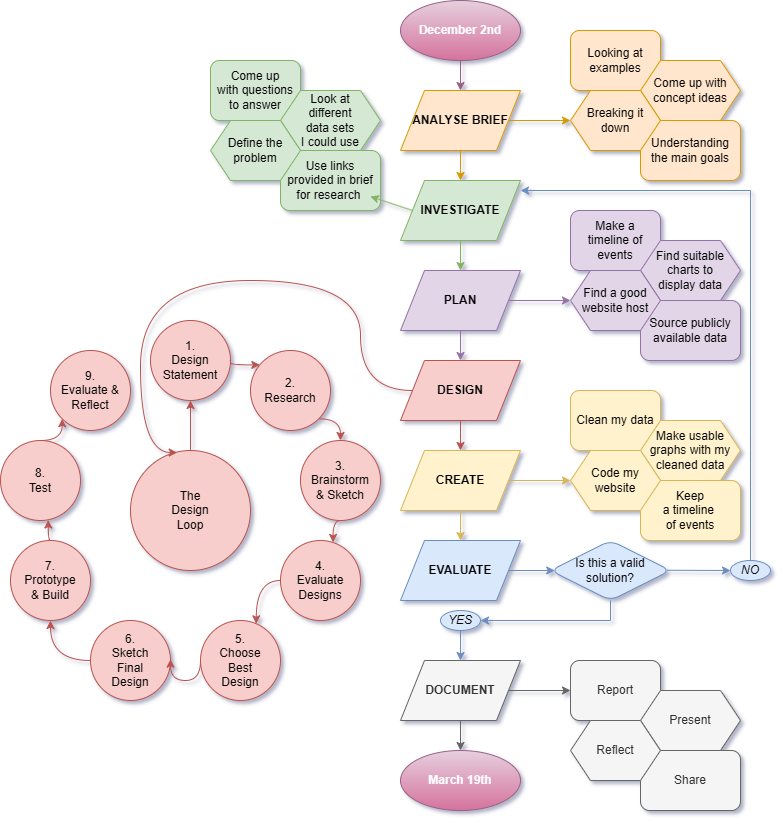
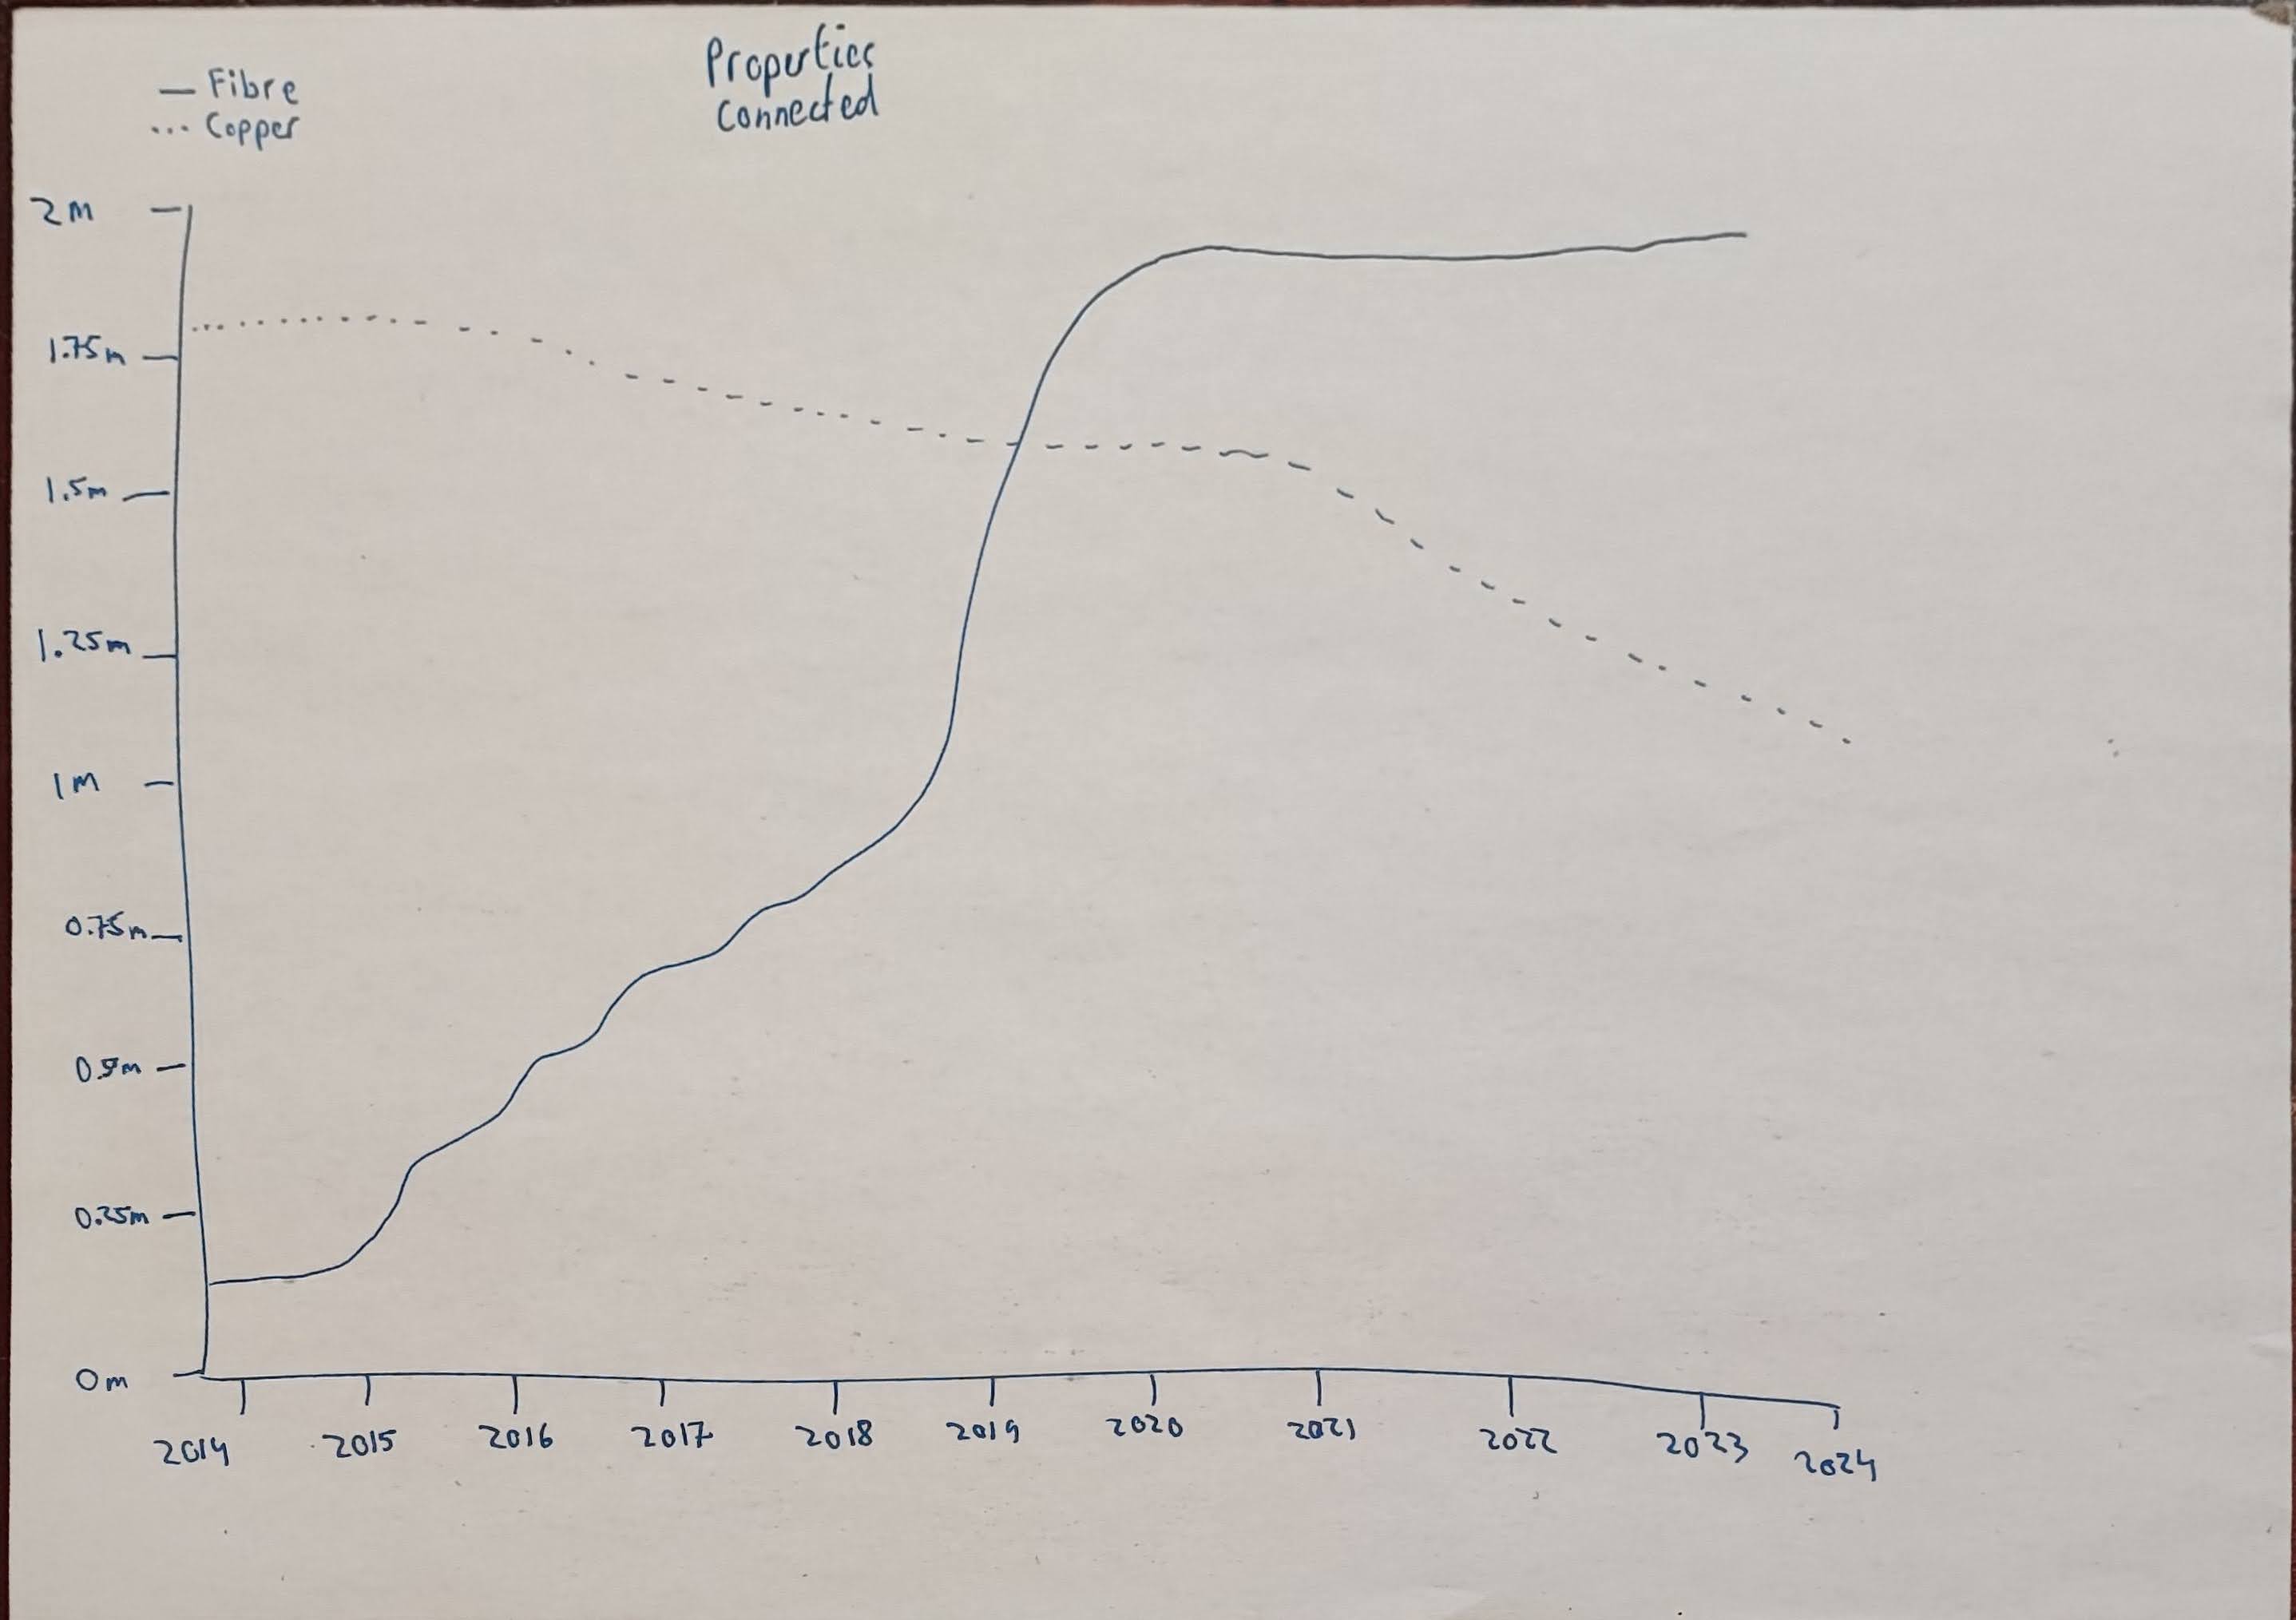
I will follow a flowchart to create my website and to analyse my data.
Staged Iterative Design Process
Flowchart
I wanted to have a simple design, so this meant simple colours and simple layout. I used the section element so that it adds a nice boarder to each 'section' and I could define the section elemnt in my CSS once and then I can use it as much as I want.
4. Create
Week 1.
I analysed the brief. I also made a Google Drive folder with all the relevant documents and resources I could need.
I used my CT Skills to help me analyse the brief. I particularly used Abstraction and Decomposition here.
Week 2.
I planned out what I was going to do each week. I started doing a bit of investigation.
I used my CT Skills to help me plan out my project. I particularly used Pattrn Recognition here.
Week 3.
I started coding the base for my website, getting the colour theme sorted out and having a blank canvas ready for me to use.
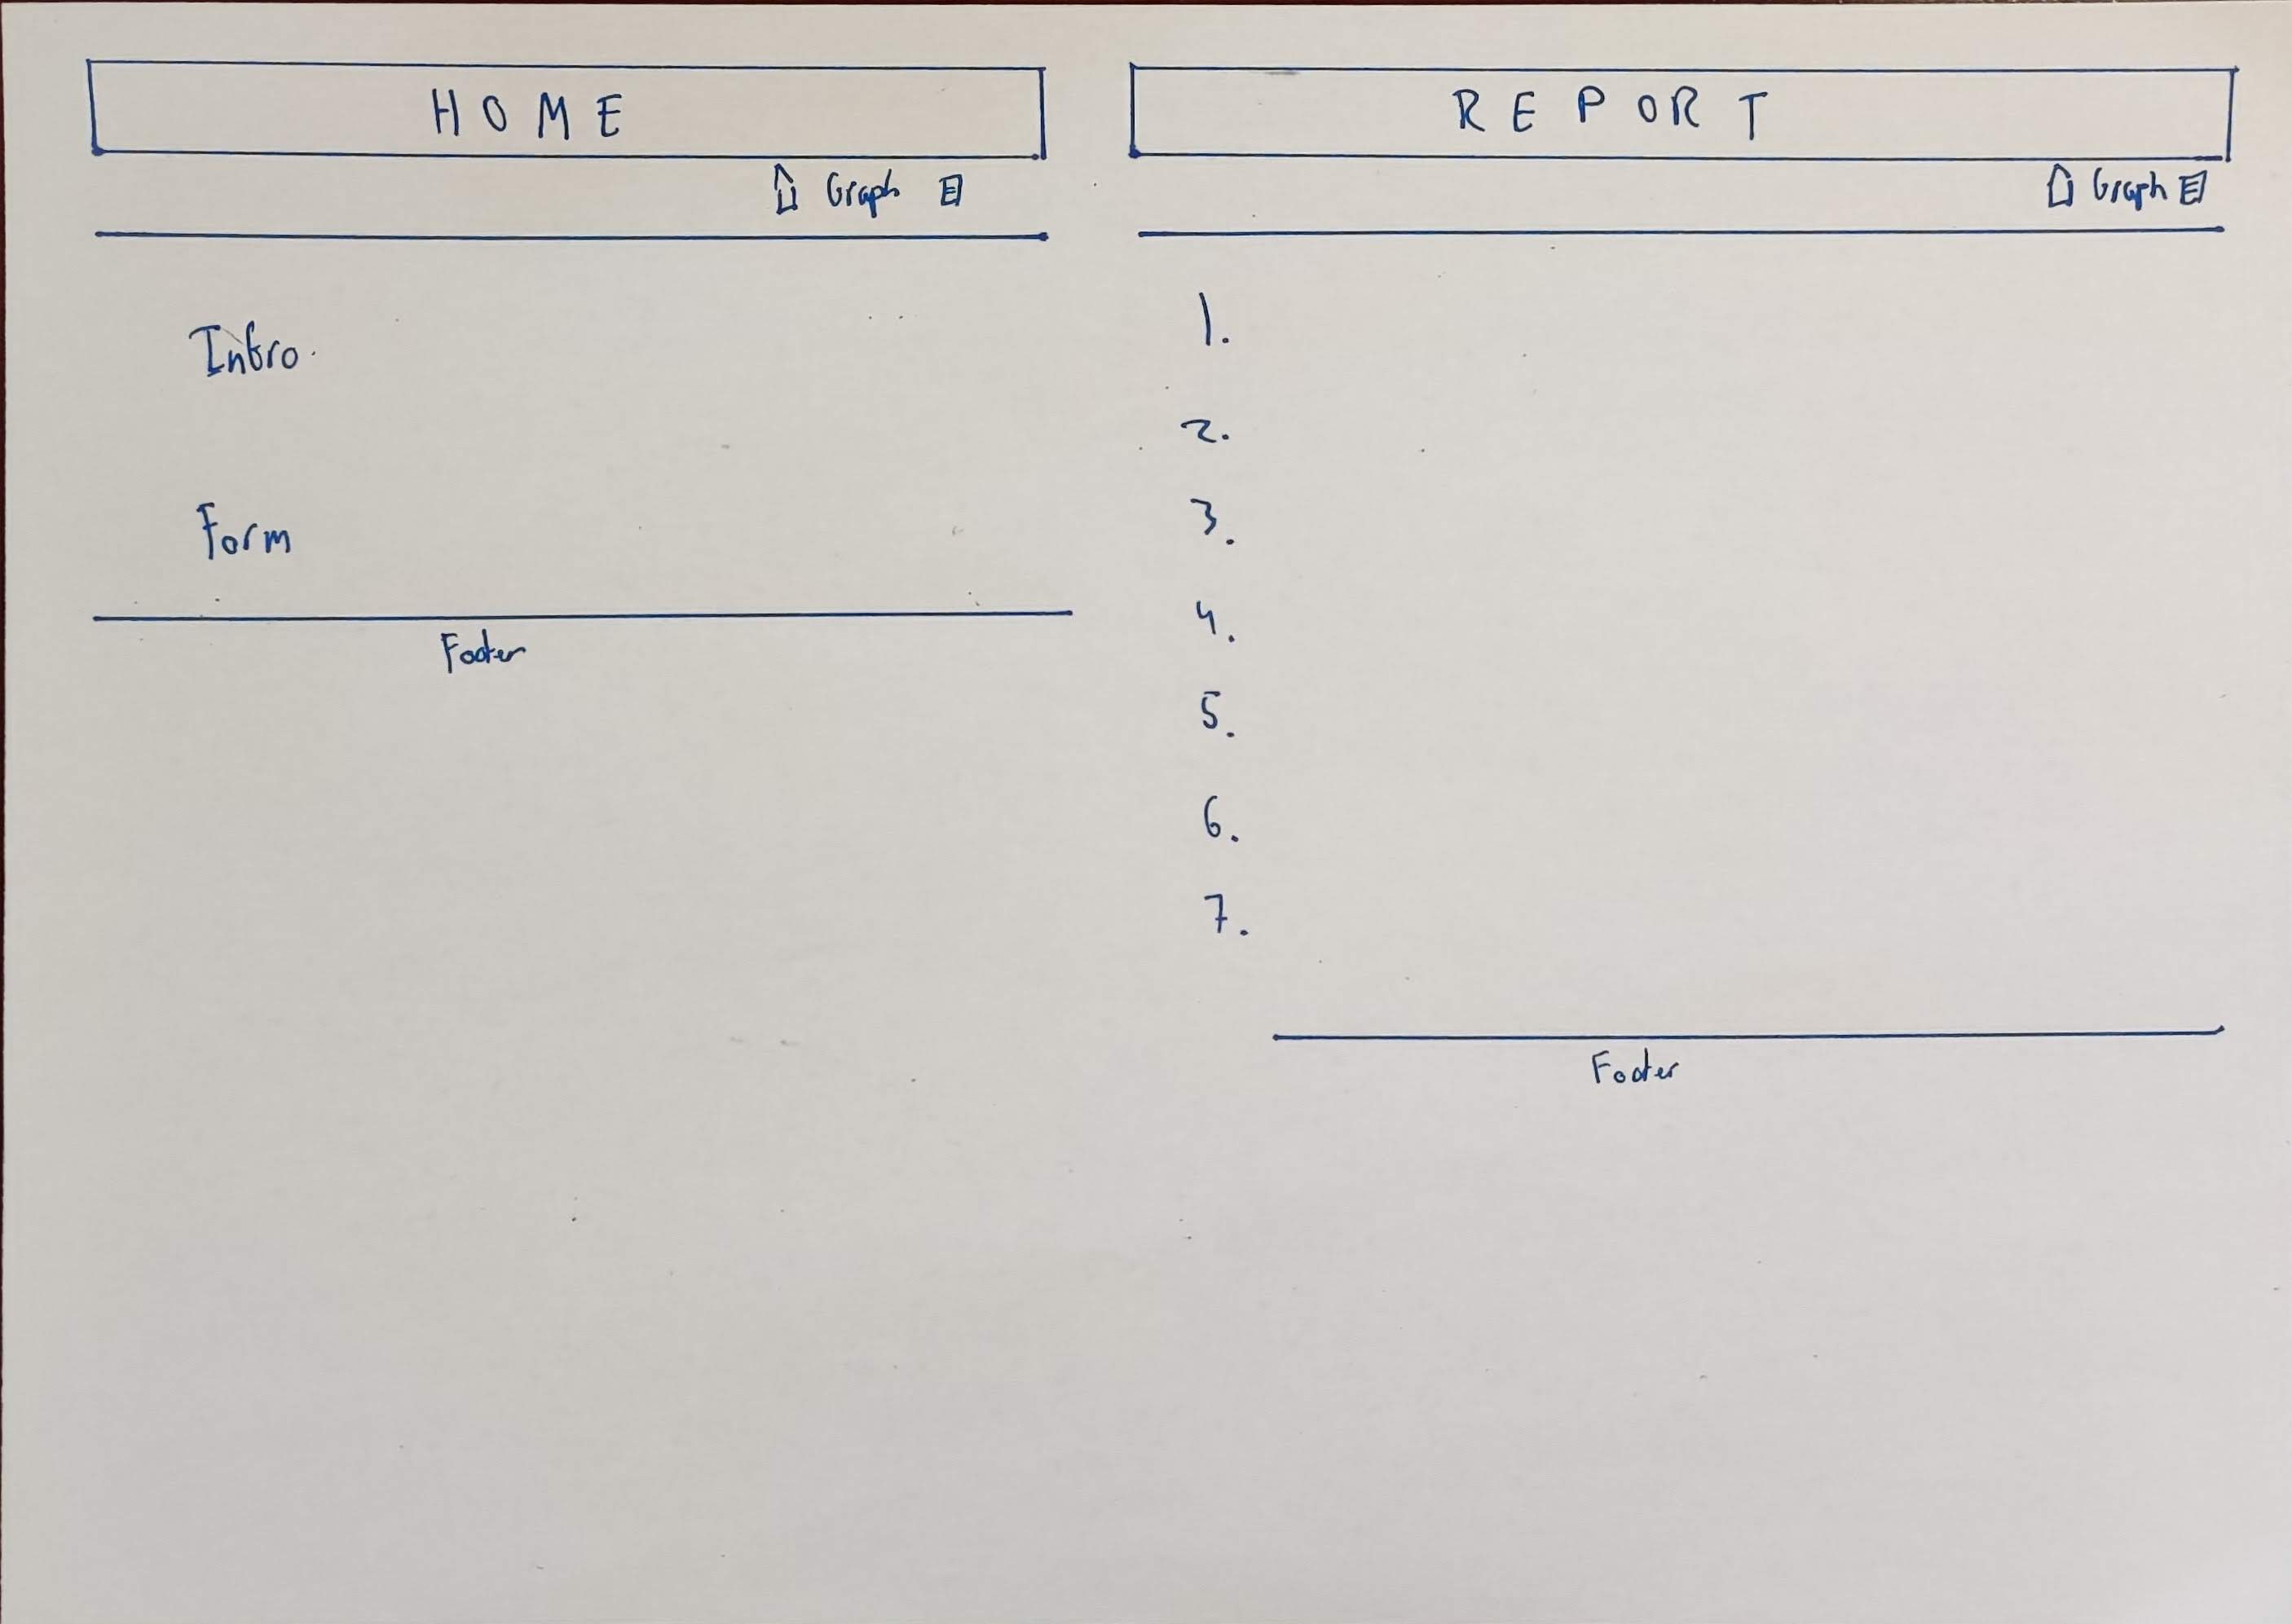
Wireframe
Week 4.
I prepared several emails to NBI and 2 of ComRegs customer emails. I had them scheduled to be sent early the next week.
Week 5.
I answered back to the response I had received. In one of the responses I got the data I needed so I made a plan on what I needed and how I was going to use python to extract the data I would need to make into graphs.
Week 6.
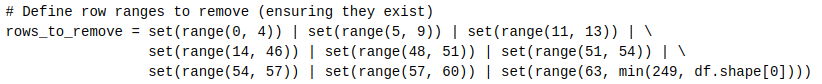
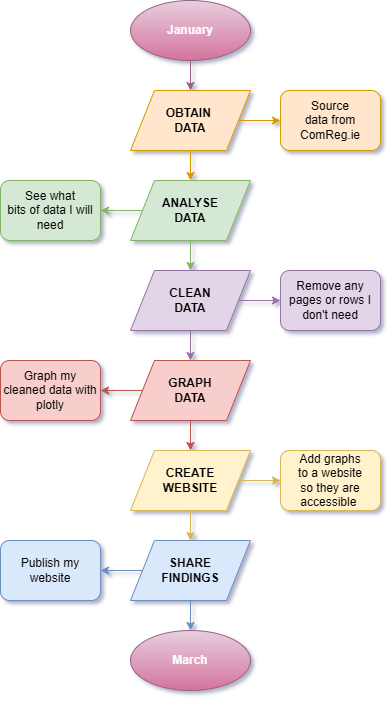
I started writing some code to clean and extract the data so I was left with just the stuff I needed. I found this quite challenging as there were some issues with the code I was originally trying to use. See the photos below to see a comparison with my original idea and the one that I ended up using.
Original Code
New Code
I used my CT Skills to help me plan out my project. I particularly used Algorithmic Thinking here.
Week 7.
I started getting some of my work on to my website. I also changed the colour scheme slightly to suit the aesthetic a bit more. This was super easy though as I had set the colour rules before so I only had to change one value once. See fig x for more details.
Week 8.
I finished my code to make the graphs using Plotly.
Sample Graphs
Week 9.
I first tried to add my graphs to my website and added a navigation bar to the top of their page. But as this was unsuccessful, I added them as separate pages.
Week 10.
I started to gather up my research and work to start making my report. I took photos of wireframes and [insert photo] made sure that my references list was up to date.
Week 11.
I added the finishing touches to all my files. I will have made my video on me using my code and websites. I will have organised all my code and data into folders and then zipped up ready for submission.
Flowchart
5. Evaluation
As a whole project I am really proud of it. I am happy I was not only able to source that data I wanted but it gave us some information on how Irelands network speeds are improving. I think I did really well with cleaning my data. I had a lot of bumps in the road with getting the rows and columns I needed but eventually I got it figured out.
There are definitely some improvements I would make if I were to do something similar. I think the biggest disappointment for me is the fact that the interactive graphs on the website have to open to a new tab. I did try to embed my navigation and footer into them but it was taking up too much time. I do really think that it would have helped make the website more fulfilling if a new tab didn’t open every time you wanted to view my data.
Another thing I think that will help make it more doable again would be to highlight all the different things my python cleaning code needed to contain. I just started cleaning my data and used whatever made sense to clean it. When I was reporting on my code, I had to go through and pick out the bits that I could say I used like list or boolean statements. I did however have most of the requirements and there were only a few things that I needed to tweak to fit the brief.
While I am still making this very report, I am very proud of my work but also feel like my report could be better. I find working things on paper quite hard but I will mention as much stuff as I can in my video to help clarif my projet as a whole. I think moving on in the future, I would really like to work on my writing skills so I don't necessarily need to explain things in person or over a video.
But by far the most important thing I got out of this project was the hugh amount of peer to peer I got to be a part of. Not only was I able to help my peers out with code or formaint the project from here to here but I was also able to learn from them and not only make my project better but help me grow as a person.